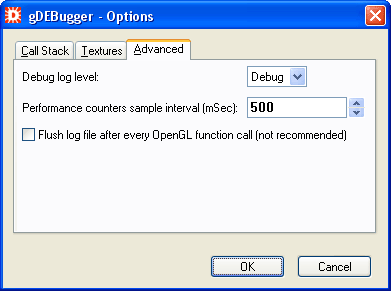
The Advanced tab lets you control advanced setting of the gDEBugger applicaiton.

The debug log level is an internal mechanism aimed to help fixing gDEBugger problems. There are three levels for the debug logging:
Log errors that rise while running gDEBugger.
Log errors and gDEBugger internal information that rise while running gDEBugger (default logging level).
Log gDEBugger debugging information, errors and other internal information that rise while running gDEBugger (to gDEBugger support team locate a problem inside gDEBugger).
The number of milliseconds elapsed between performance counters samples.
When the Flush log file after every OpenGL function call check box is checked, gDEBugger will flush the OpenGL calls history log file after every OpenGL function call instead of not use memory cached batches. This feature can help tracking the function call that led to a debugged application crash. Using this feature slows down dramatically the debugged application performance and therefore it is not recommended to be used regularly.